
There is much talk of the “power” of social media, particularly as it relates to disseminating messages (positive and negative) and propagating narratives. We are in a divisive age that is seeing a rise in right-wing prominence and an accompanying increased willingness to “share” racist, homophobic, misogynistic, and antisemitic ideas using the Internet and social media platforms as vehicles. Therefore, it becomes even more important for digital humanists working in these areas to interject themselves into these conversations. It is also a way for scholars to take the important step into the public arena and to apply their work to public, contemporary issues. One of the ways of doing this is a deep dive into, for example, who on Facebook is disseminating Holocaust denial materials (see the work of historian Jennifer Evans, for example).1 However, one of the drawbacks of this important methodology is timeliness, in that it takes a considerable amount of time to complete the necessary research. On the other hand, the data gained can be incredibly rich and insightful.
 When the Baraboo Hitler-salute photograph surfaced this week, I was interested in what the public response would be. I turned to Twitter. What follows is a discussion in two areas simultaneously: first, how can we use social network analysis to evaluate the immediate response to the Baraboo incident on Twitter and, second, how this methodology in general can help us understand who the players, communities, and points of view are.
First, some necessary research-related caveats. Twitter is not the world. It certainly does not represent all discourses or conversations taking place. On the other hand, because it is so public and time-sensitive, it can give us an idea of any given developing public conversation or debate. Analyzing conversations on the social media service can also show us who, specifically, some of the most influential people in those conversations are.
Before we get to the fun stuff, I have to briefly explain how the visualizations you are about to see were produced. For various aspects of my scholarly research on the Holocaust, I use a program called Gephi, which is a very high-powered and sometimes complex platform for analyzing social networks. Social Network Analysis (SNA) can be quite involved (as is anything where the word “algorithm” appears). However, at its core, it allows us to visualize (and statistically analyze) the relationships between things. We call these “nodes” and “edges.” Simply put, a node is a thing (person, place, word, report, letter, hashtag, etc.) and an edge is a relationship (supervised, sent, received, lived there, knew, loved, retweeted, liked, etc.). SNA allows us take large amounts of data and organize them into visualizations that show us things like what node is most influential, which nodes serve as the lynchpins for any given social media community, who or what is sending/receiving the greatest number of messages, etc. This is fantastically useful in digital history, but also in creating quick analyses of current events.
The Gephi platform has a plugin that allows users to import Twitter data in real time (you can even record the development of the network and play it back). However, to do this, you need to choose a methodology. For example, you can input a user (or users) and see who they are tweeting, retweeting, mentioning. You can input a word (or words) and see who is engaging with them. You can also simply enter a hashtag and see what other hashtags are being used in association with that one. Once you have collected a sufficient amount of data (and sometimes this can take place in minutes or hours—consider entering #MeToo), you can begin to analyze.
Gephi offers a wide variety of algorithms to manipulate and characterize the data. Some are very complex but others are fairly self-evident. Degree, for example, simply shows which nodes are most significant to the network. The layouts (also algorithm driven) display this as well by placing less significant nodes farther from the center. Modularity, on the other hand, shows “how well a network decomposes into modular communities.” It is important to note, here, that “”[t]hese sub-networks (or communities) have been shown to have significant real-world meaning.”2 Eigenvector centrality measures the influence of various nodes. All of these elements can be visualized with colors and sizes, as we will see.
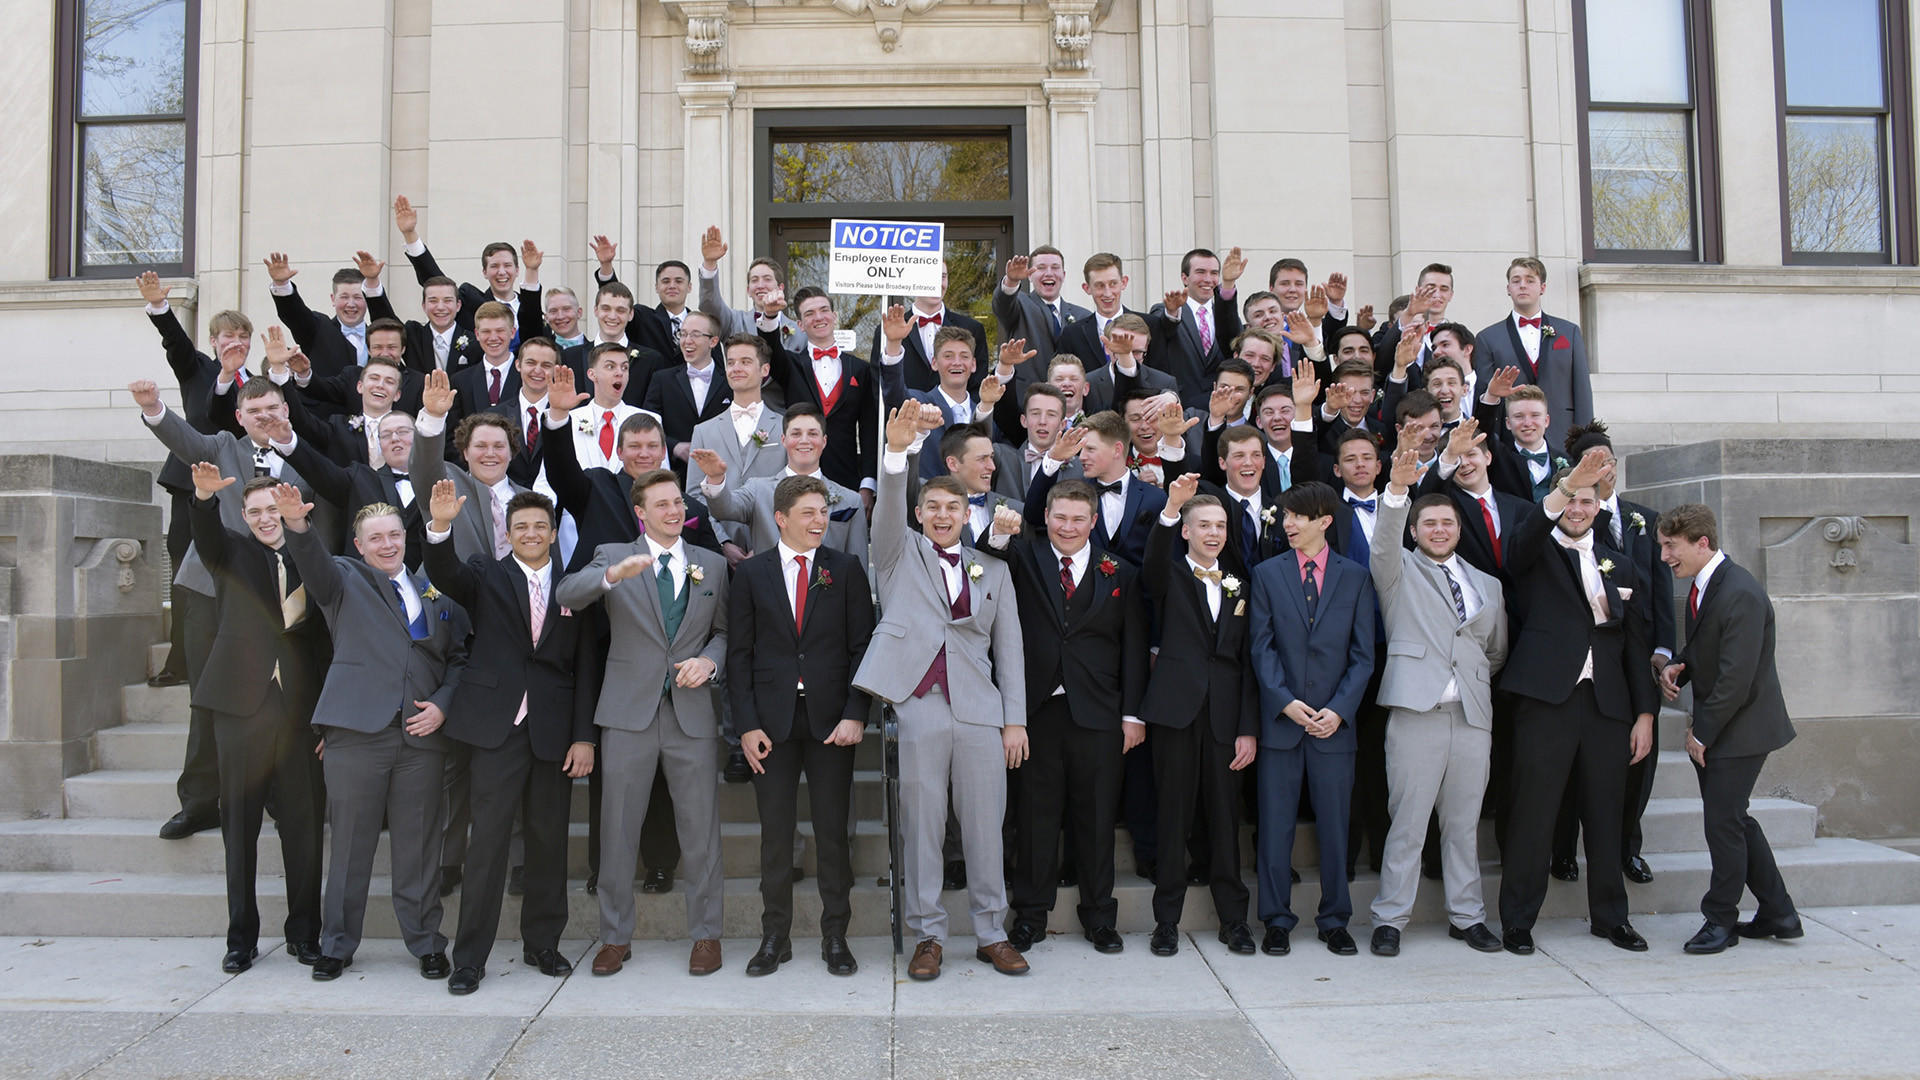
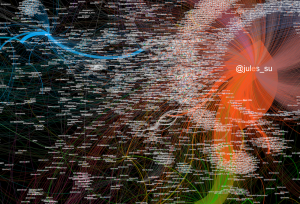 So, if you have made it this far, congratulations! Now we can see a little of this in action. When the Baraboo photo surfaced, I was curious about what the Twittersphere would say, expecting a partisan debate. I entered “baraboo” and “barabooproud” as words to follow and let Gephi run. The result was the visualization below after I manipulated it in Gephi (Figure 1). Nodes are color-coded by community (modularity) and sized by influence (degree). This particular snapshot was the day after but is little different from the day of. We see that the main influencer, not surprisingly, is the reporter, Jules Suzdaltsev, who broke the story. An interesting “first responder” was also the Auschwitz Memorial Museum. Other influencers were reporters Glenn Thrush (New York Times) and Jamelle Bouie (Slate). But we also see Jordan Blue, the boy who refused to salute appearing (see photo above). The Baraboo School District account, not surprisingly, was both receiving and sending tweets that were receiving widespread attention. A bit farther out we see the very influential historian Kevin Kruse weighing in but also a Princeton graduate student who also writes for mainstream media, David Walsh. We also see Ryan Knight, an LGBTQ activist. (You can explore the full network by zooming in on the large PNG image.)3
What does this mean? Well, first it tells us how quickly the initial tweets from Suzdaltsev took off. More importantly, however, it shows which news outlets were attuned and which were not. The big market media (CNN, MSNBC, FOX) are not at all strongly represented. It was individual reporters that were initially passing this on. Another observation is that there was almost no presence from conservatives or alt-right types praising or debating the coverage. This was not what I had expected to see and was surprising.
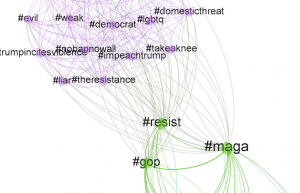 The second analysis I ran was of the hashtags that were being used (#baraboo, #barabooproud, #barabooshame, #jordanblue). This kind of visualization provides a different way of looking at the popular response as it simply shows the hashtags that are being used together or are associated (Figure 2). The communities here are pretty clear. #MAGA and #GOP figure prominently. To be clear, this visualization does not indicate whether they were being used in a positive or negative context, simply that they were central and together. Here, unlike in the user analysis, we also see more disturbing hashtags: #ProudBoys, #AltRight, #Nazi (again, with no context as to who is using them or why.) The point is that these are the shorthand that Twitter users were applying to this event which is insightful. (But do not forget to note that #Wisconsin and lots of places appear as hashtags, too, associated with Baraboo.)
 Finally, I want to step away from Baraboo to show how this methodology can be useful in taking the temperature of political events relevant to our shared interest in Fascism. I am particularly interested in ultra-right Polish nationalism and how it intersects with antisemitism and Holocaust memory. This was particularly interesting to me in the context of the Independence Day March which included the President, Prime Minister, active military…and fascists. So, I ran a very simple analysis of the word “Poland” by users (Figure 3). One would imagine that I would get a dizzying variety of communities talking about all kinds of topics. However, for the most part, the main influencers were alt-right nationalists (Stefan Molyneux, Jack Posobiec, and another account associated with Posobiec: @polishpatriottm). There was one major Trump supporter (@Jamierodr10) who was dangerously close to veering into far-right territory. There was one major influencer (@youranoncentral) which is an antifascist group. The only other significant community was the Polish boy band HRVY.
So, what does this rather extensive discussion tell us about the utility of this kind of rapid social network analysis? I would argue several things. First, it is a quick and relatively easy way of seeing precisely who is talking about important issues (in this case race, neo-Nazism, etc.). This is both informative and can help drive dedicated responses on social media by showing who is friend and foe…and sometimes by outing people one would not expect to be sympathetic to racist ideologies. It also provides us with a tool for reading the temperature of any particular public debate. The fact that simply the word “Poland” would essentially generate responses from the alt-right is very instructive. In addition, the hashtag form of data mining almost automatically creates a discourse analysis of sorts: what concepts are being associated with each other. Finally, I should note that this is relatively easy for anyone to do with Gephi. With some time devoted to learning how to use the software, it can serve as a very accessible method for visualizing discussions on important issues related to fascism and the rise of the New Right both here in the United Sates and abroad.
Waitman Wade Beorn is a Lecturer at the University of Virginia’s Corcoran Department of History
Notes
- Jennifer Evans, “Facebook, Connective Memory and Online Activism” (journal article in preparation for publication).
- See the following URL: https://github.com/gephi/gephi/wiki/Modularity/
- See the following URL: https://drive.google.com/file/d/1bxN78iA4fv-2OzTZQf7yDfNCFkRwabpg/view
Leave a Reply